
ACCENT WEB APP
The ACCENT web application is currently under development, for questions or further information about this, don't hesitate to contact us!
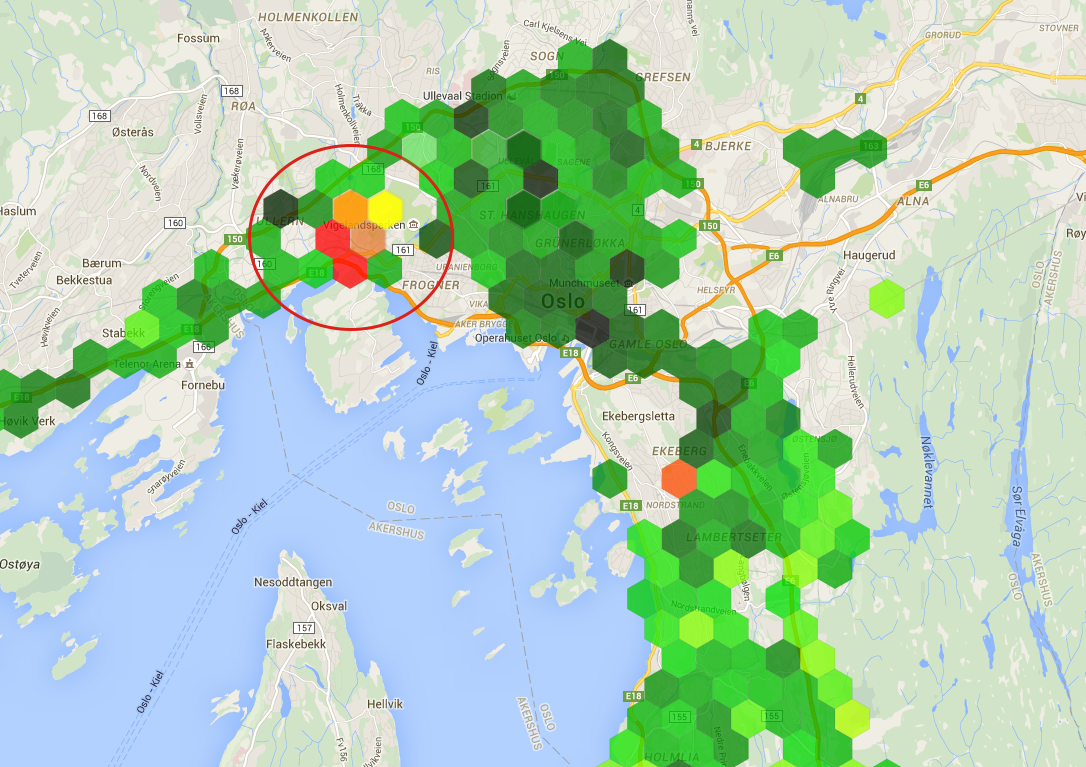
In the web application, the measurement data from the mobile app can be analysed further. There are two main views, the first one being the statistics view providing an average of all measurements (or a subset) in the database. Issues in the network can easily be spotted on a high level in this view. The map can display different kinds of information, e.g. RX-level or cell ID. The resolution and averaging changes automatically when the map is zoomed in or out. This way the coverage of a whole country or just a small street can be investigated. The mobile app automatically uploads the logfiles to the database, and the measurements are available instantly.
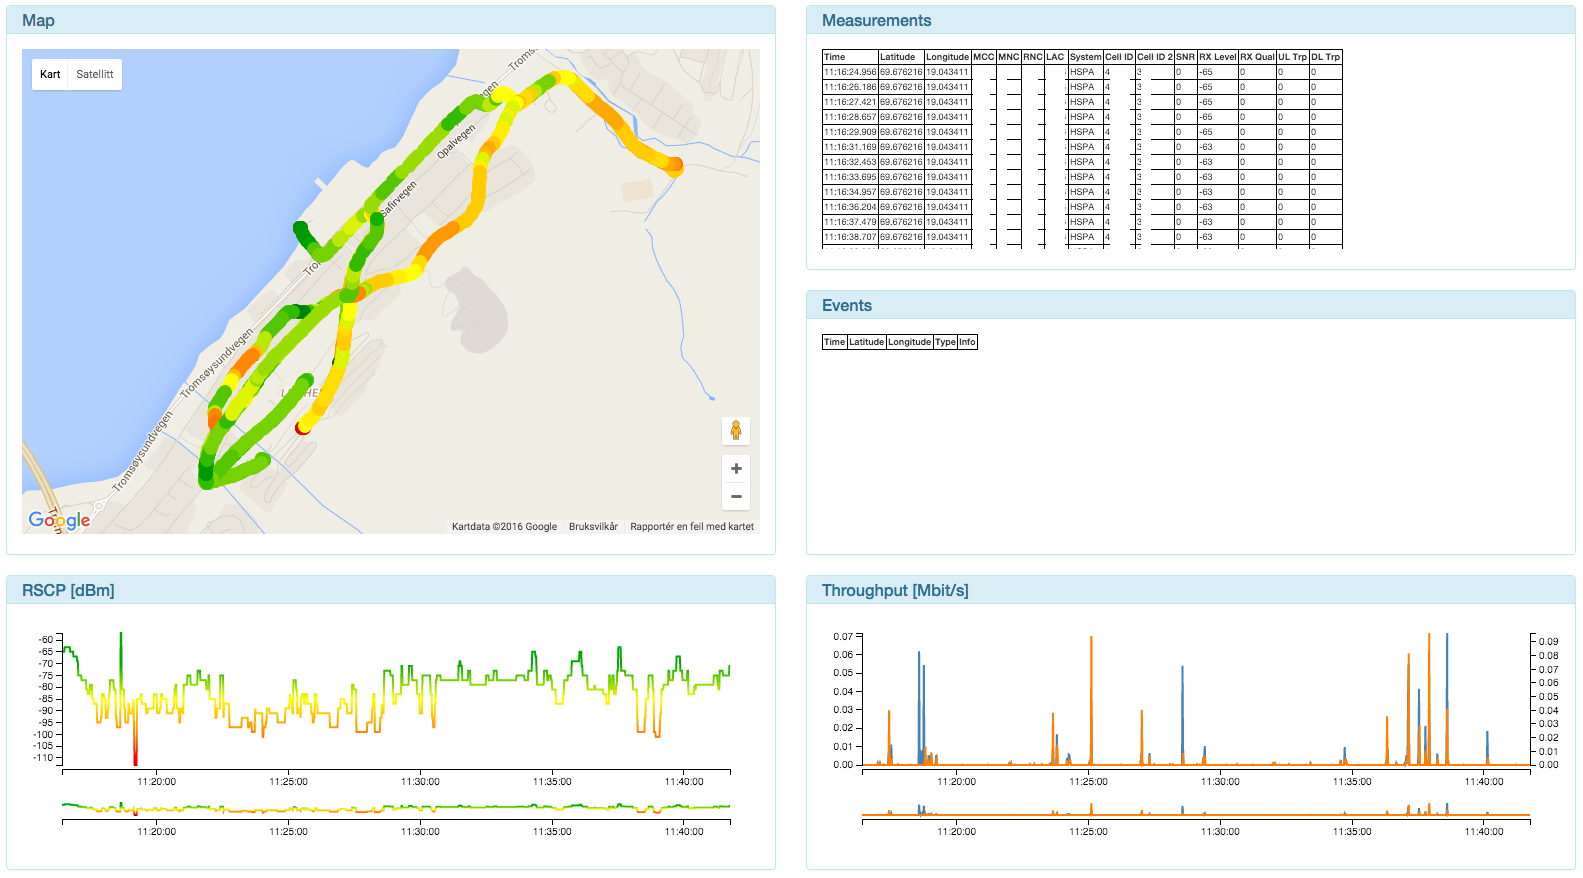
The second view is the detailed logfile view. In this view individual logfiles from the mobile app can be investigated further with maps, graphs and tables, providing advanced analysis of the network. All kinds of measurements can be visualized in the maps and graphs, e.g. RX-level, quality and cell ID among other things. There are also automatic analysis tools available, such as tools for investigating Pilot Polution etc.